Airline Industry 2018
‘Airline Industry 2018’ report consists of global and regional market overview, as well as market drivers, challenges and trends.
Read the UPDATED version of this report here: Airline Industry Outlook: 2019
Airline Industry Overview – 2018
Airline industry directly or indirectly facilitates global trade, tourism and economic growth. Thus, it is key to the advent of globalization taking place in many other industries.
In the last few decades, international airlines have aggressively expanded their reach to new markets globally, through establishment of alliances and partnerships. Most of the major airlines now command global presence.
However, airline industry is also one of the most cyclical as well as volatile industries that’s extremely susceptible to political, economic and social factors.
Also, airline industry is characterized with extremely low profit margin. Besides internal cost factors, airlines’ profitability is also highly correlated to economic growth; as it directly affects demand for air travel and trade. Thus, airlines have to constantly evolve and improve to survive and remain profitable amid such external fluctuations.
The global airline industry was adversely affected during the 2008/2009 recession. However, along with the improvement in global economy, the airline industry has also shown strong performance in recent years, including improved profitability.
Global Market Overview
Passenger Numbers
As per IATA, passenger numbers are expected to rise from 4.1 billion passengers in 2017 to 4.3 billion passengers in 2018 (+6% growth).
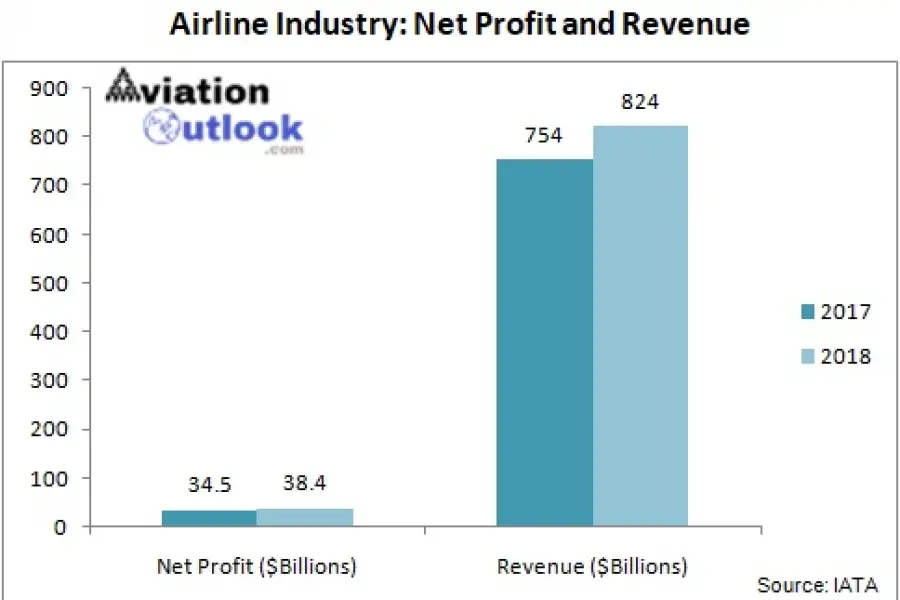
Revenue and Profits
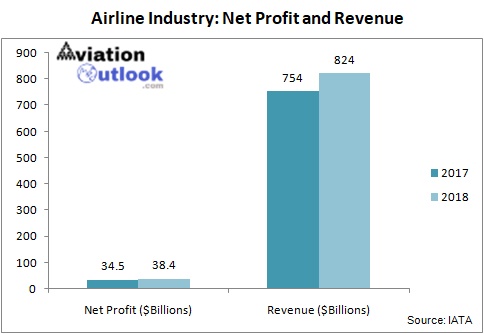
The overall revenue is expected to rise from $754 billion in 2017 to $824 billion in 2018 (+9.4% growth).
Global airline industry net profits will reach $38.4 billion in 2018, increasing from $34.5 billion in 2017.
Regional Market Overview
Want to read it later? Download full report for FREE NOW!
North America
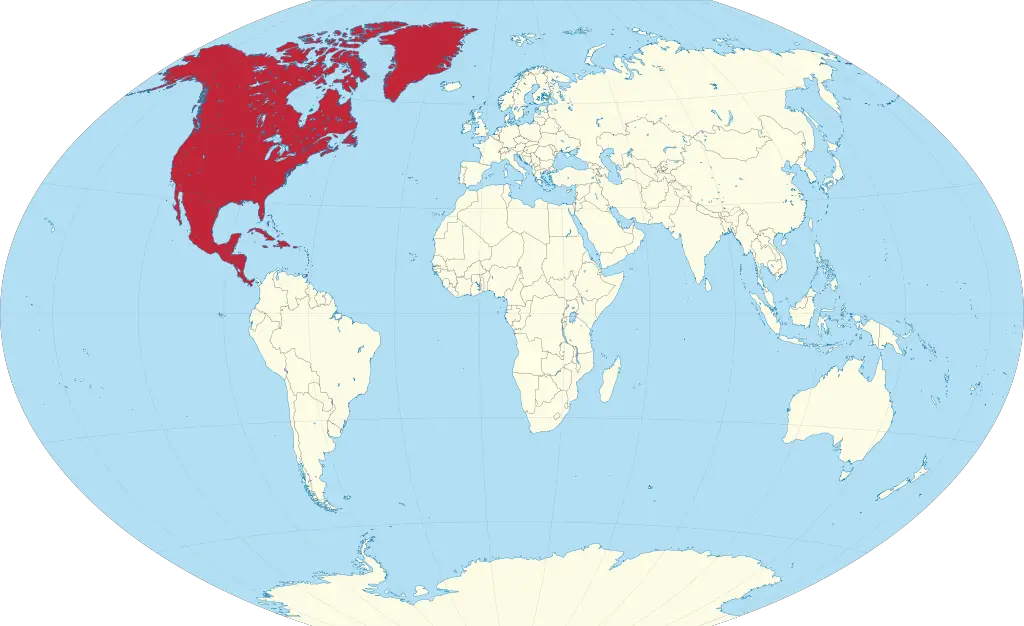
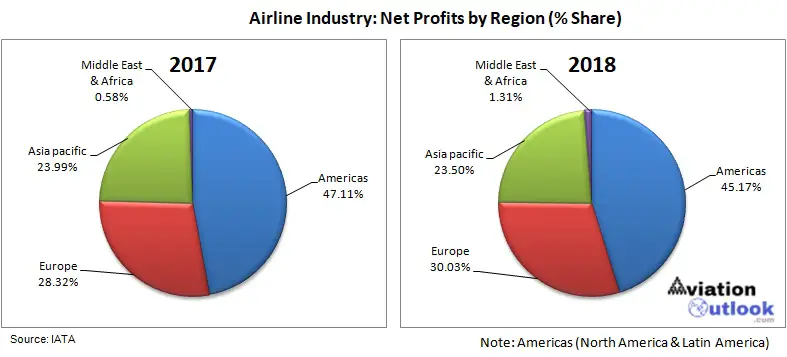
North America is currently the largest airline market in the world and also accounts for nearly half of the entire global airline industry’s total profits.
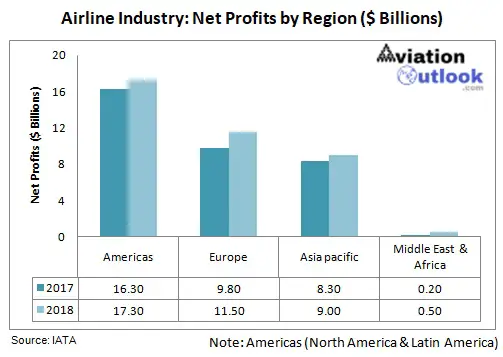
Net profits for North American airlines are expected to increase from $15.6 billion in 2017 to reach $16.4 billion in 2018. (Source: IATA)
Top Airline Routes: North America (By Two-way Seat Capacity, 2017), Source: OAG
- Los Angeles (LAX) – San Francisco (SFO)
- New York LaGuardia (LGA) – Chicago O’Hare (ORD)
- Los Angeles (LAX) – New York JF Kennedy (JFK)
- New York JF Kennedy (JFK) – London Heathrow (LHR)
- Toronto Lester B Pearson (YYZ) – Vancouver (YVR)
Largest Airlines in North America (By Passengers Carried, 2017)
Largest Airports in North America (By Available Departure Seats, 2017)
- Atlanta Hartsfield-Jackson
- Los Angeles
- Chicago O’Hare
- Dallas Fort Worth
- New York JF Kennedy
For 2018, IATA expects the capacity growth in the region to be 3.4%, indicating for a stronger market conditions.
Challenges
However, rising fuel prices and labor cost will remain a challenge to the airlines in this region.
The airlines in this region have employed a low hedging strategy in comparison to the airlines in other parts of the world. This makes the airlines in North America more susceptible to oil price fluctuations and are thus among the hardest hit during such scenarios.
Also Read: Aircraft Industry Outlook 2019

Asia-Pacific
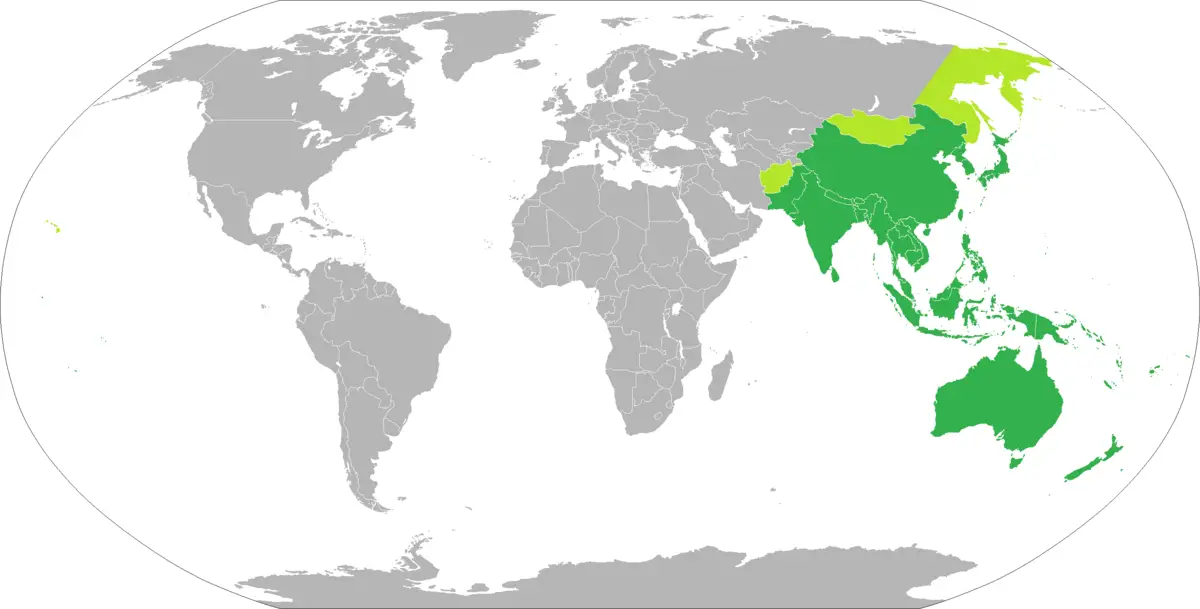
Profits for airlines in Asia-pacific region are expected to rise from $8.3 billion in 2017 to reach $9 billion in 2018. (Source: IATA)
This is mainly because of the strong economic growth currently witnessed in the region. The average annual GDP growth of 3.9% is projected for the Asia-Pacific region, for the next 20 years.
As per Boeing, the region’s share of Global GDP will rise from 33% currently to around 40% by 2036.
The robust economic growths in China, India and other Southeast Asian countries have led to strong domestic airline market growth in these respective countries.
Air Cargo Market
Also, Asia-Pacific region is a powerhouse in terms of global trade, which in turn leads to a strong air cargo market in the region.
As per Association of Asia Pacific Airlines (AAPA), Asia-Pacific region accounted for two-fifth (roughly 40%) of the global air cargo traffic in 2017.
For the next 20 years, the air travel demand in the region is expected to grow at 5.7% annually, and will account for nearly 40% of the global air passenger traffic.
Challenges
However, considering the growth in demand for air travel, the region is not coping that well in terms of infrastructure. Major airports in the region including Bangkok, Manila and Jakarta are said to be in dire need for major upgrades.
Also, the major markets including China is struggling with air traffic management. As a result, the country is facing serious problem of flight delays.
Many of these delays are due to excessive demand whilst at limited capacity expansion, as majority of the airspace is still under military control, while commercial services are restricted to limited access.
Also, the Asia-Pacific airlines lag behind North American carriers in terms of profitability. In 2017, the North American Airlines were estimated to have attained a net profit margin of roughly 8.5% (and average profit of $20 per passenger) whereas it was around 2.9% (and average profit of $4 per passenger) for Asia-Pacific airlines.
One of the reasons for lower profitability is also that most of the airlines in the region are still aggressively opting for capacity growth.
Also, low-cost airlines are growing rapidly in the region. Intense competition and hence competitive pricing is predominant in the region, which has also led to comparatively lower profit margin.
Largest Airlines in Asia-Pacific (By Passengers Carried, 2017)
- China Southern Airlines
- China Eastern Airlines
- Air China
- Hainan Airlines
- Air Asia Group
Largest Airports in Asia-Pacific (By Passengers, 2017)
- Beijing Capital International Airport
- Tokyo Haneda Airport
- Hong Kong International Airport
- Shanghai Pudong International Airport
- Singapore Changi Airport
Europe
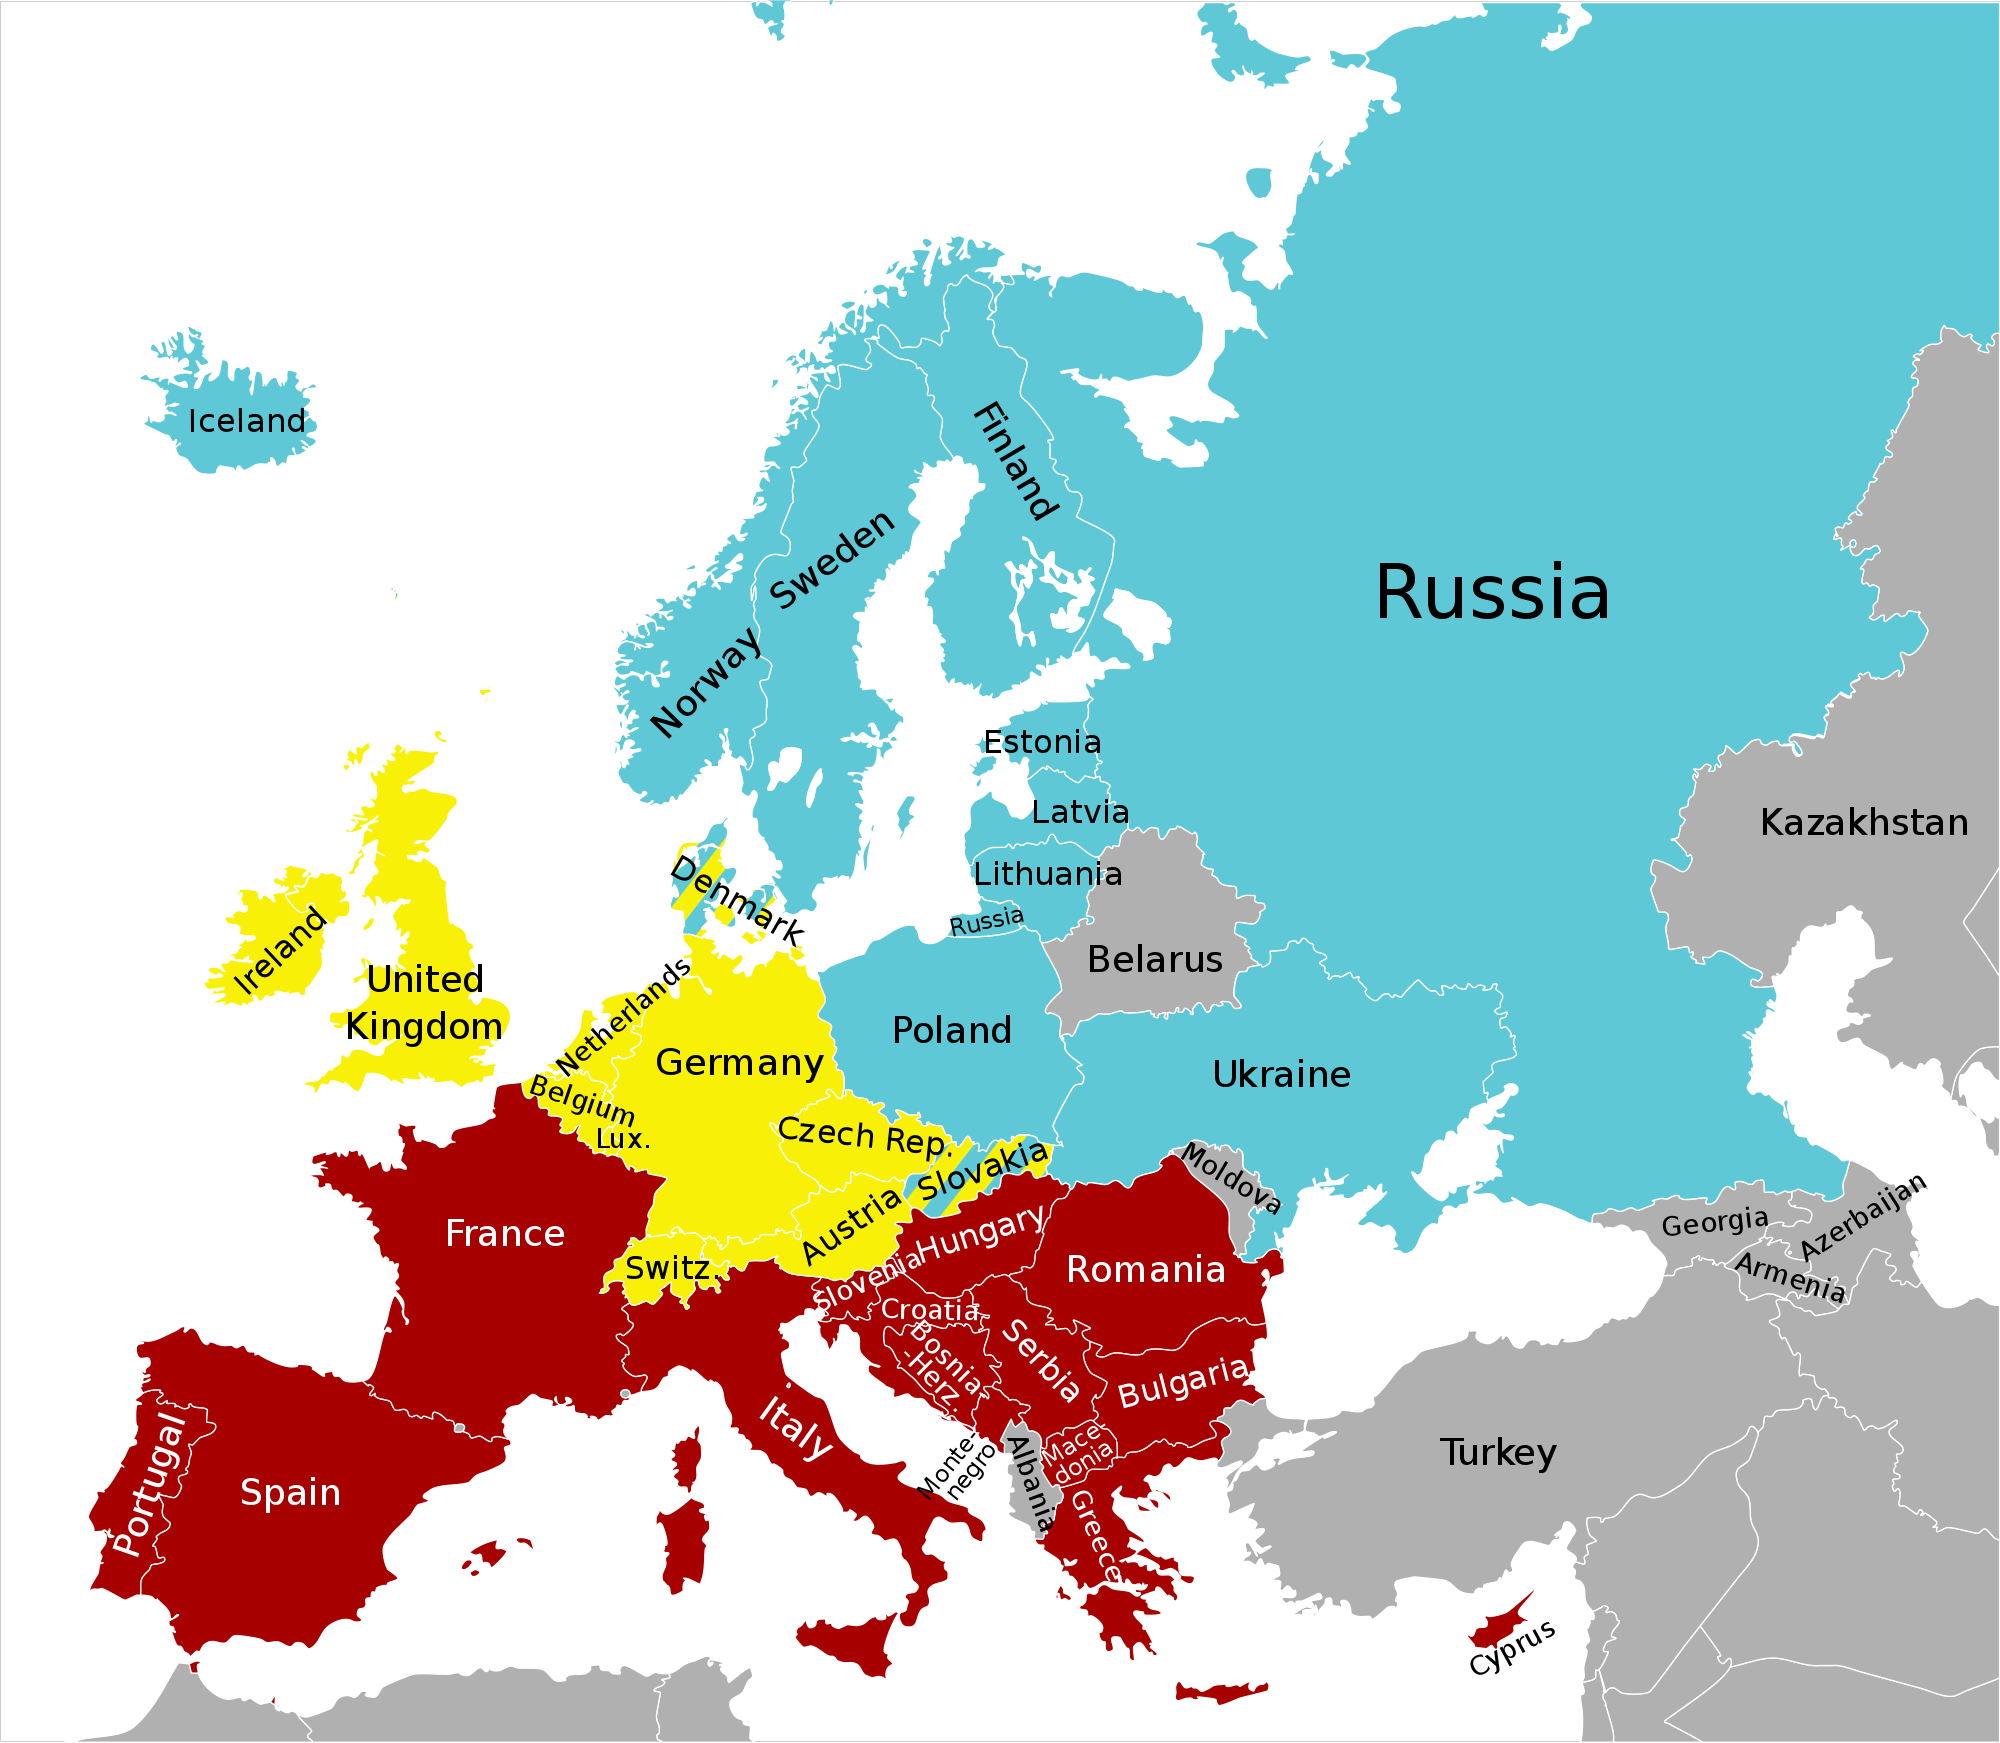
Net profits for European Airlines are expected to increase from $9.8 billion in 2017 to reach $11.5 billion in 2018. (Source: IATA)
The economic recovery in the region, including in markets such as Russia has led to the satisfactory demand and helped the airlines in the region.
IMF (International Monetary Fund) raised its growth forecasts for the euro zone for 2018.
Business confidence in Europe, as per Eurostat’s economic-sentiment index was also stated to be at its highest in over a decade.
Also, in 2016, terrorist attacks in Brussels and Turkey adversely affected tourism in the region. At the time, US had issued travel warnings for travelers to Turkey and Europe. It was reported that the overall tourism industry in Europe lost more than $299 million as a result.
However, the region rebound from those incidents and again saw growing arrival of tourists in 2017, hence leading to a comparable improvement in air travel in 2017.
But…
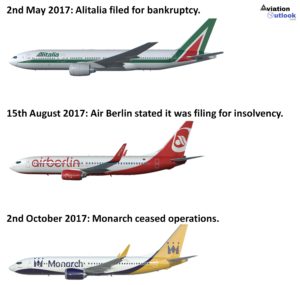
Several airlines went bust in 2017. It was more related with weaker and inefficient players crumbling ‘under the fierce competition and constantly evolving business models of low-cost airlines, rather than any other external factors.
Also Read: What’s Wrong with European Airlines?
More airlines might go bust or consolidate in the future as it had happened in the US domestic airline market earlier, which led to the creation of top 4 airlines which now cover almost 80% of the US domestic airline market share.
In my opinion, this could eventually lead to strengthening of the European airline industry in the coming days while wiping out the weak and poor performers.
Growing transatlantic demand is another ‘silver lining’ for the airlines in the region in the upcoming future.
However, Brexit is one of the biggest uncertainties for the airlines and they need to plan accordingly to survive the probable political and economic consequences.
Largest Airlines / Airline Group in Europe (By Passengers Carried, 2017)
- Lufthansa Group
- Ryanair
- International Airlines Group (IAG)
- Air France – KLM
- easyJet
Largest Airports in Europe (By Passengers, 2017)
- Heathrow Airport
- Charles de Gaulle Airport
- Royal Amsterdam Airport Schiphol
- Frankfurt Airport
- Istanbul Atatürk Airport
South America
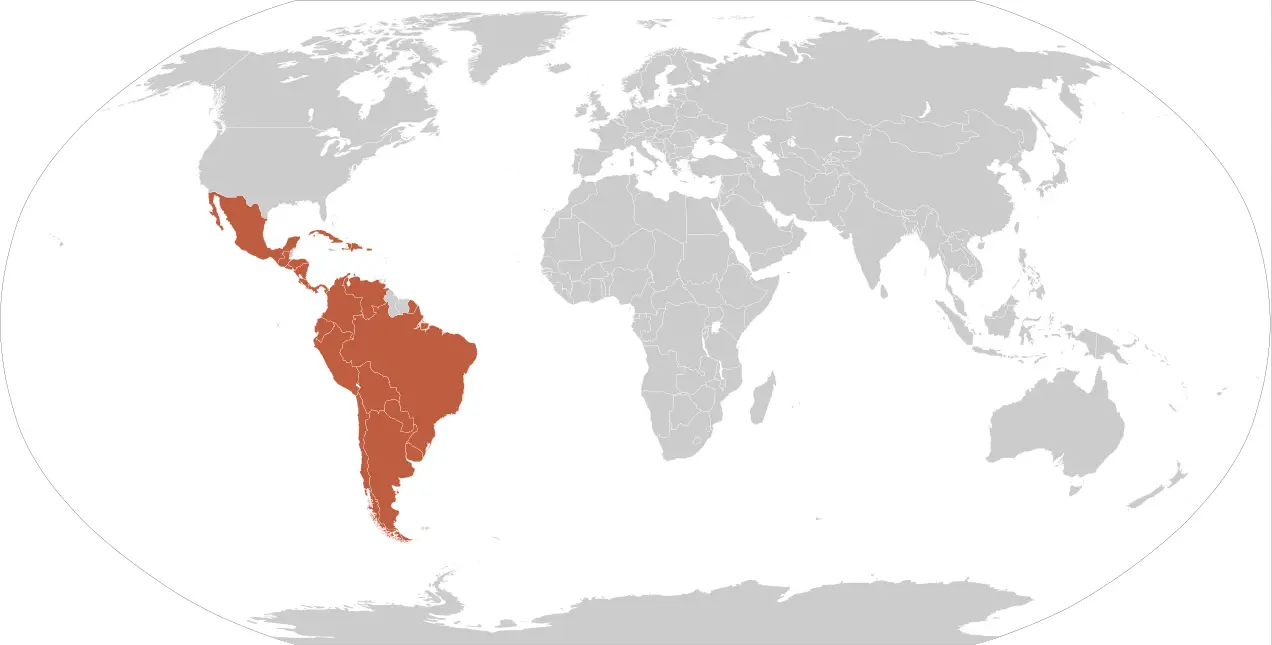
Airlines industry in South America is forecast to generate a $900 million net profit in 2018 (up from $700 million in 2017).
Reasonable growth in Mexico and recovery in the Brazilian economy have helped the market performance to a great extent.
Regional GDP growth of South America was estimated to be around 2.3% in 2017 and similar growth is expected for 2018 as well.
Also, the middle class population in South America is expanding which will contribute to the growing demand for air travel.
Low Cost Airlines in South America
Although, low-cost airlines or low-cost carriers (LCCs)have seen tremendous success throughout the world, it surprisingly lags behind in this region.
Four large full-service carrier groups currently dominate the South American airline market, accounting for more than 40% of the total capacity.
However, this lower penetration of low cost airlines in the region could in turn emerge out to be an untapped market opportunity for South America.
Along with the correction in market characteristics that has currently hindered the growth of LCCs, new LCCs could emerge and expand, bringing competition and passenger growth.
Challenges
However, poor infrastructure and regulatory challenges are prevalent in the region. According to worldbank, Latin America spends only about 3% of its annual GDP on infrastructure development.
To cope up with the growing demand, the region needs to invest more, as well as improve its airports and air traffic control infrastructures.
Largest Airlines / Airline Group in South America (By Passengers Carried, 2017)
- LATAM
- Gol Transportes Aéreos
- Avianca Holdings
- Azul Brazilian Airlines
- Aerolíneas Argentinas
Largest Airports in South America (By Passengers, 2017)
- São Paulo–Guarulhos International Airport
- El Dorado International Airport
- São Paulo–Congonhas Airport
- Rio de Janeiro–Galeão International Airport
- Brasília International Airport
Middle East
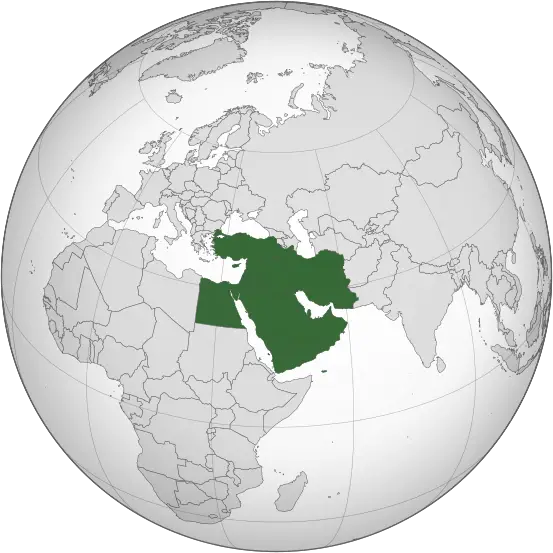
Middle East carriers are forecast to see net profits improve to $600 million in 2018 (up from $300 million in 2017), as per IATA’s forecast.
With that profit figure, Middle Eastern airlines currently exhibit a very low profit margin of just 0.6% (earnings before interest and tax), which is only higher than Africa, with profit margin of 0.5% of revenues.
Diplomatic Crisis of 2017
Regional conflict was one of the main reasons that affected the Middle Eastern airline market last year.
In June 2017, several Arab countries (including Saudi Arabia, United Arab Emirates, Bahrain, and Egypt) cut diplomatic ties with Qatar and imposed regional blockade (severing air, land and sea links) accusing it of supporting terrorism in the region.
The regional blockade forced Qatar Airways to fly longer routes via Turkey and Iran, which adversely affected the airline’s economic performance. On Feb. 13 2018, Qatar Airways’ CEO said that the airline will post a loss for the 2017 financial year, and regional blockade is the main reason for this outcome.
US Imposed Travel Restrictions
In early 2017, US president Trump imposed controversial laptop ban on passengers onboard US bound flights from certain airports in the Middle East and Africa. This created panic and confusion among the travelers and adversely affected the airlines’ US-bound flights. The laptop ban was lifted few months later.
During the mid-2017, US-imposed another travel ban on six Muslim-majority countries (Iran, Libya, Somalia, Sudan, Syria and Yemen) which was a much bigger blow to the airlines in the region, including large carriers such as Emirates Airlines, Turkish Airlines, Qatar Airways and Etihad Airways.
Changing Dynamics of ‘Superconnectors’
The three large airlines in the Middle East; namely Emirates Airlines, Etihad Airways and Qatar Airways are considered the superconnectors in the region. These airlines achieved aggressive growth based on their business model of positioning their respective location in Middle East as the center hub of the world to connect East and the West.
This model succeeded to a great extent and positioned these three airlines as the large superconnectors. Along with their superior service and competitive pricing, these three airlines quadrupled the number of passengers they carried each year, in the last decade.
However, the same geo-political factor that helped the airlines achieve this aggressive growth is also a high-risk scenario to these airlines, amid volatile regional tensions brewing in the region again.
Also, the rising ambitions of Turkish Airlines, another large airline from the region to establish itself as the new ‘superconnector’ and shift in the ‘hub gravity’ to Istanbul is another major threat that could challenge the other three superconnector’s dominance.
Turkish Airlines already flies to more than 300 destinations in 121 countries, the largest amongst all the global airlines. The airline has also been performing well and reported its highest ever Load Factor in January with 79.8%. It also posted double digit growth (29%) in demand (revenue per kilometer) in January 2018.
With such aggressive growth ambitions, Turkish Airlines will try to attract long-haul travelers away from the existing Dubai, Abu-Dhabi and Doha hubs.
So, expect more intense competition among the airlines in the region in upcoming days. However, despite posing an increased challenge to the existing superconnectors, overall it’s a good sign for increasing demand and healthy prospect for the airline industry in the region.
Thus, despite the geo-political challenges, the momentum of the Middle Eastern airline industry is expected to remain positive in 2018.
Largest Airlines in Middle East (By Passengers Carried, 2017)
- Emirates Airlines
- Saudia
- Qatar Airways
- Etihad Airways
Largest Airports in Middle East (By Passengers, 2017)
- Dubai International Airport (Dubai, UAE)
- Hamad International Airport (Doha, Qatar)
- King Abdulaziz International Airport (Jeddah, Saudi Arabia)
- Abu Dhabi International Airport (Abu Dhabi, UAE)
- King Khalid International Airport (Riyadh, Saudi Arabia)
Africa
As per IATA, African airlines are expected to make small loss of $100 million in 2018, same as in 2017, despite the expected 8% growth in demand and 7.5% capacity expansion.
It’s mainly because of the slower pace of economic growth in the continent that’s affecting the airlines in the region.
African Economy
The continent had witnessed a sharp slowdown in economic growth in 2016, and the continent’s largest economies including Nigeria and South Africa just emerged out of recession in 2017, however their growth still remains sluggish. As per World Bank, the economy of Sub-Saharan Africa was around 2.4% in 2017 up from 1.3% in 2016 and is projected to reach 3.2% and 3.5% in 2018 and 2019 respectively.
While traffic is growing, passenger load factors for African airlines are just over 70% which is over 10% points lower than the industry average.
Higher operational cost, restrictive aviation policies and fragmented skies for intra-African connections makes it very difficult for the African airlines to make profit at such low utilization rate.
However, African Union’s concerted effort to further liberalize and promote growth of intra-Africa connectivity through the formation of SAATM is a development in positive direction.
Single African Air Transport Market (SAATM) Initiative
On 28th January 2018, 23 African countries (now 28) signed for SAATM initiative by African Union (AU). It’s a major step to open up the African skies and also unite the highly fragmented aviation skies in Africa.
Earlier, most of the African airline industry operated based on bilateral air service agreements between the respective two countries. While, deregulation, liberalization and policies such as ‘open skies’ became established in other regions of the world, which eventually led to increase in traffic flow across the regions; meanwhile in Africa it remained constricted until now because of quite stringent bilateral agreements.
As a result, the continent’s aviation industry remained fragmented, inefficient, costly and could not develop to its full potential, considering its vast population and demand for air travel in recent years.
However, potential increase in intra-African air connectivity as part of this SAATM initiative will hopefully bring huge benefits to the entire aviation industry in Africa.
As per a research conducted by IATA, it was found that if only 12 countries in Africa (Algeria, Tunisia, Egypt, Ethiopia, Kenya, Uganda, South Africa, Namibia, Angola, Nigeria, Ghana, and Senegal) adopted more liberalization and opened their skies to each other, it would add $1.3 billion to the GDP, add 155,000 new jobs and more importantly the air fares would drop by 35%, enabling an extra 5 million Africans to afford air travel.
Thus, this initiative by 28 African countries that “provides for full liberalization in terms of market access between African States, the free exercise of traffic rights, the elimination of restrictions on ownership and the full liberalization of frequencies, fares and capacities” could bring stark changes to the single continent.
Largest Airlines in Africa (By Passengers Carried, 2017)
- EgyptAir
- South African Airways
- Royal Air Maroc
- Ethiopian Airlines
- Tunisair
Largest Airports in Africa (By Passengers, 2017)
- R. Tambo International Airport (Johannesburg, South Africa)
- Cape Town International Airport (Cape Town, South Africa)
- Mohammed V International Airport (Casablanca, Morocco)
- Tunis-Carthage Airport (Tunis, Tunisia)
- King Shaka International Airport (Durban, South Africa)
Airline Industry Trends
- Airlines are incorporating more technologies into their operations,
- Big-data and analytics has found a great foothold in airline industry as a way to measure internal performance as well as gain insight of external factors that could in turn affect the business,
- According to SITA, airlines and airports planning to use Artificial Intelligence (AI) in various forms jumped from 24% in 2016 to 45% in 2017.
- Biometrics and RFID for self check-in, passport control, baggage tracking and security is being more of a norm.
- It’s also good to see airlines seriously looking into hot new technologies such as ‘blockchain’ and even considering ways that it could be incorporated to their benefit.
Market Drivers
- Strengthening global economy,
- Growing demand for air travel and improved efficiency expected to help profitability in 2018 despite rising costs,
- Low-cost carriers are sprouting throughout the globe and have made air travel accessible to millions of new flyers,
- Burgeoning e-commerce has helped drive the growth in air cargo market,
- Airlines have been expanding and launching new routes as the financial outlook and demand has been favorable.
Airline Industry Challenges
- Rising fuel cost and labor expenses have been a challenge and will remain so,
- Jet fuel prices are expected to average $81.6 per barrel (up from $65.6 in 2017). Thus, fuel is expected to constitute roughly more than 20% of the airline’s operational cost in 2018 (up from 18.8% in 2017),
- Labor costs are expected to constitute 30.9% of the airline’s operational cost in 2018. Labor/manpower now constitutes more than the fuel cost and has been increasing,
- Regional and political uncertainties will also remain a challenge (Brexit in Europe and regional tensions in Gulf region).
Threat of Substitutes
-
Alternative modes of transportation
Passenger transportation is in general dominated by railways or roadways (passenger vehicles such as car, bus, bikes etc).
Air transportation is still the preferred or the only viable mode of transportation for long distances. However, the possibility of threat in the near future from high-speed railway network or emerging transportation systems (such as hyperloop) should not be discarded altogether.
As high-speed and cheap alternatives for transportation improve, passengers could re-evaluate these alternatives over the issues with air travel, such as booking/checking-in/security hassles, relatively higher ticket price and negative environmental impact.
Bargaining Power of Suppliers
-
Aircraft manufacturers
Aviation industry generates billions of dollars worth of revenue, of which majority is comprised of civil aircraft, engines, equipment, and parts.
For commercial aircraft engines, the major manufactures include Pratt & Whitney (now part of UTC), Rolls-Royce and General Electric (GE) in partnership with Safran (France).
For commercial aircraft, Boeing and Airbus have complete duopoly in the larger aircraft segment, whereas Bombardier and Embraer have good share of the market in the regional aircraft market segment.
There are few other aircraft manufactures from Russia, China and Japan vying to gain their foothold in the commercial aircraft industry. However, it will take few more years before these new entrants could even make their presence felt in the market. Challenging the incumbent’s dominance in the market seems quite far-fetched for now.
Thus, the market dominance of these selective few OEMs will surely not diminish in the near term.
In this term, these few aerospace giants have relatively high bargaining power over the airlines.
However, the introduction of new airline business models focusing on cost savings and postponed aircraft orders e.g. through buying options instead of fixed contracts has forced the aircraft manufacturers to give up much of their remaining bargaining power by focusing on supporting these airline business models to secure their own survival.
The best example of this case is the recent Airbus A380 deal between Airbus and Emirates, which solely helped save the A380 program, which might have been otherwise most possibly at the brink of collapse.
-
Airport Infrastructure
The supplier role of the airports is affiliated with the aeronautical services, which they provide for the airlines.
Primary airports still have more bargaining power than smaller airports as they have reached critical mass and are not as susceptible to contract demands.
-
Labor Unions
The airline industry is highly labor intensive and salary for employees such as pilots, cabin crew, customer service and gate agents have historically been accounting for one of the largest share of an airline’s expenses.
Furthermore, many employees in the airline industry are well organized in different types of labor unions, thus strengthening their bargaining power.
One of the best examples of labor union’s bargaining power was seen during the merger deal between American Airlines and US Airways, which could be termed as a Union-driven merger in some ways.
In this case, American Airlines’ labor unions negotiated alternate labor agreements in secret with US Airways forcing American Airlines’ merger with US Airways, in their terms to some extent.
-
Jet Fuel Suppliers
The Kerosene-type jet fuel (including Jet A and Jet A-1) that’s most commonly used in gas-turbine powered commercial aircraft is made from crude oil and the prices of two are highly correlated.
Airlines have little influence over the international market price for crude oil, which means that the jet-fuel suppliers are in a favorable bargaining position.
To have some extent of control, airlines could hedge the jet-fuel prices by using financial derivatives or develop and use bio-fuel.
Aerospace companies (Boeing and Airbus) and several airlines are already members of Sustainable Aviation Fuel User Group (SAFUG), whose primary goal is to develop and help commercialize sustainable types of bio-fuels.
Also, the ongoing research and development towards electrification of aircraft will help airlines gradually shift towards hybrid and then hopefully all-electric flight (at least for short haul flights) in the future. This will largely help airlines reduce their operational costs, as fuel constitutes one of the largest chunk of operational expenses for airlines.
Bargaining Power of Buyers
The bargaining power of buyers can be interpreted as the opposite of the bargaining power of suppliers. Instead of raising prices and lowering product or service quality, buyers want to capture more value by demanding higher quality at lower prices.
Buyers were considered to have low bargaining power in the airline industry. However, it’s somewhat different these days.
For example, the rise of technology and internet has increased the bargaining power of the consumer as it has made it easy for a potential buyer of a flight ticket to search for, compare and buy the cheapest airfare currently available, through many third-party meta-search flight comparison websites/apps.
This ease of flight search and price comparison combined with the low switching costs for buyers in this market, has helped push down the price of air travel.
The airline industry distinguishes between two types of buyers; leisure or business travelers.
-
Leisure Travelers
Leisure travelers are defined as anyone traveling by airplane in a way that is not related to business/work.
Each individual customer has little bargaining power and is unable to push the airlines to deliver a higher quality service at lower prices.
However, with comparatively less integration of leisure travelers into loyalty programs and thus their extremely low switching cost provides this segment of travelers with certain amount of bargaining power as well.
In sum, the leisure travelers are price sensitive, face low switching cost and consider air travel to be a standardized undifferentiated service.
Consequently, this intensifies competition and draws profits away from the traditional network carriers towards the low cost airline and the customer themselves.
Moreover, the leisure travelers’ support of the low-cost airlines proves that as long as minimum requirements for service are undertaken, price is the only variable that matters.
Arguably, this has changed the dynamics of the industry and put pressure on the traditional Full-Service Carriers (FSCs) to cut costs in order to offer cheaper flights.
-
Business Travelers
Business travelers are defined as customers traveling on behalf of a company or for work related matters.
Many business people are frequent travelers and often account for significant revenue for an airline. This leaves them in a strong bargaining position which they will utilize in order to obtain several perks and discounts.
Furthermore, airlines consider business travelers valuable because they generate a stable flow of revenue and provide a high degree of certainty as they are often locked into long term contracts or some sort of loyalty programs.
Compared to leisure travelers, business travelers are less focused on ticket prices and place more emphasis on airline punctuality, high route frequency and effortless ticket service handling.
Do you need additional market insights and personalized custom report as per your requirement?